What can I do with HARP?
With around 70,000 lines of code, the HM code base is huge. Moreover, it is restricted to standard C++ language features, making STL library functions the only tool for native C++ work inside the HM code. This is a problem not only for integration of new HEVC extensions into the HM: the lack of sophisticated functions for visualizing internal data flows, for exporting/importing data from/to the running HM and for testing own assumptions about data structures and class APIs makes understanding the HM code difficult. This is where HARP comes into play...
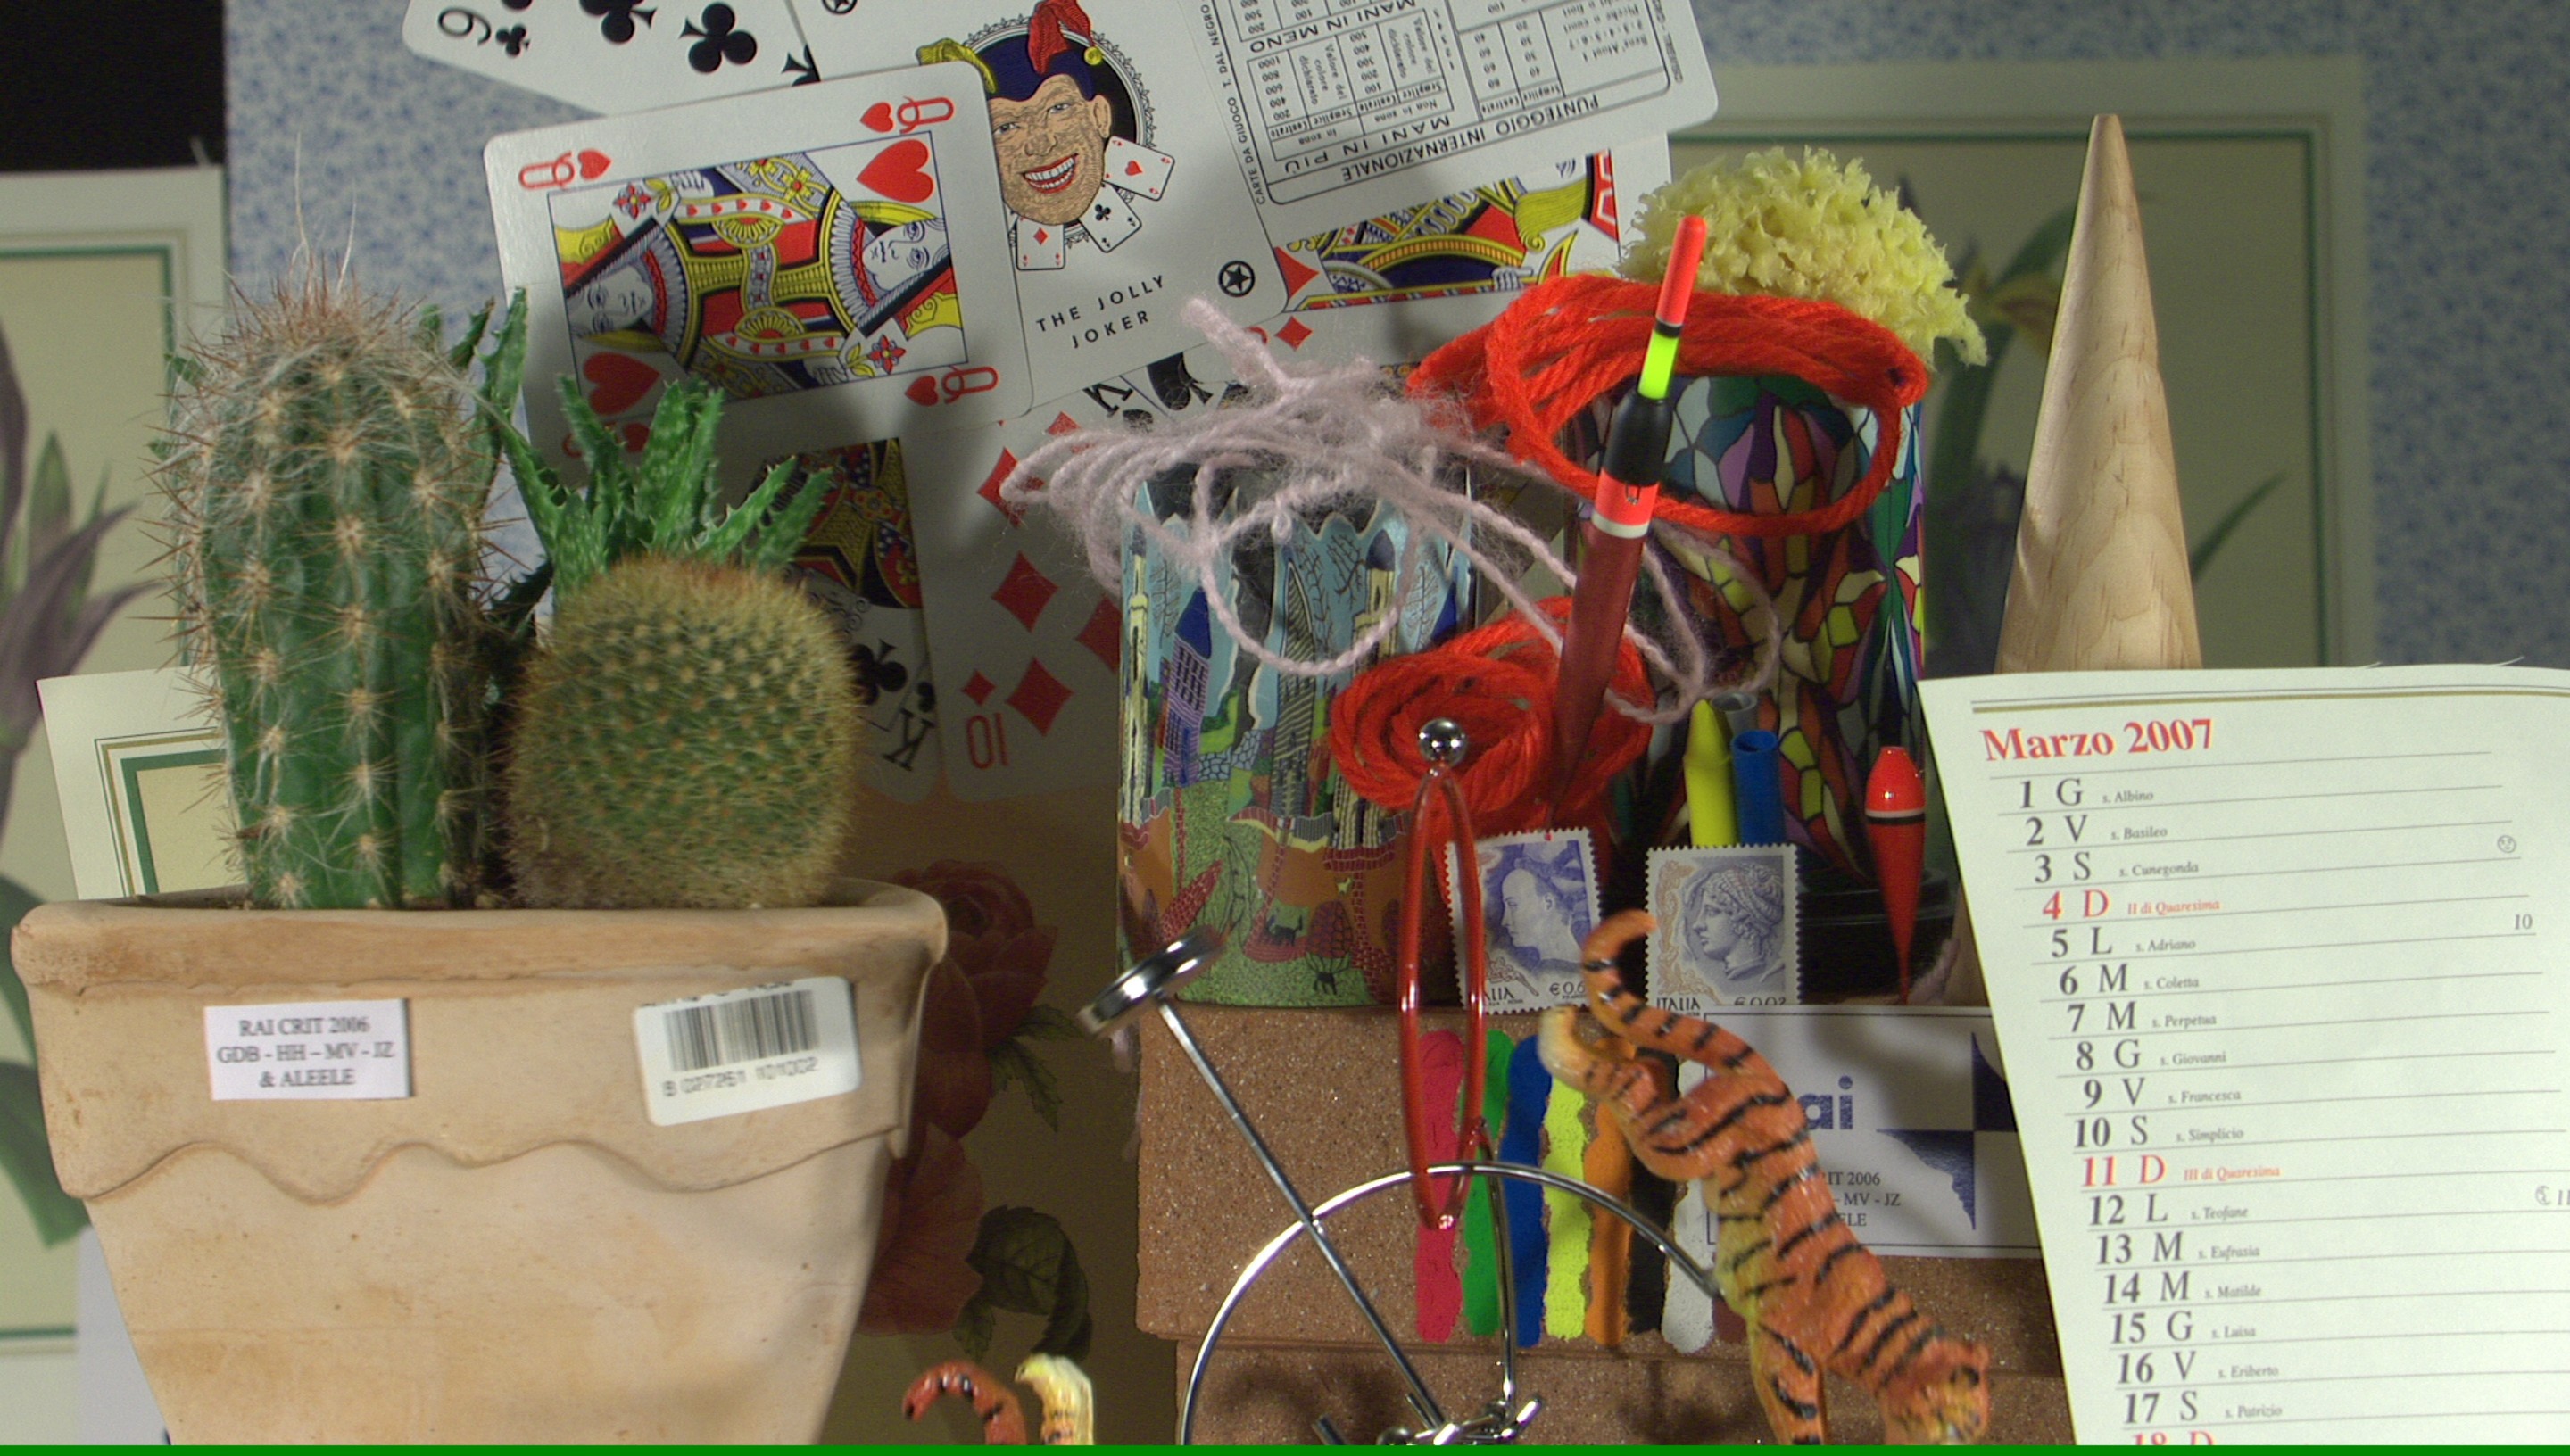
HARP is designed primarily as a tool for rapid development with the HM code base. We put emphasis on a seamless integration of OpenCV and Qt into HARP, so that anyone working on the HM code can natively make use of sophisticated C++ functions for image&matrix processing, numerical optimization, regex expressions, data import/export, GUI creation and much more. Below you see some examples of how HARP can be used for visually rendering internal HEVC information (click to enlarge). All images were generated with a running HM encoder, using the instructions in the Tutorial - Basic Usage and setting --QP=10 and Cactus_1920x1080_50.yuv as input. For RDO visualization of CTU 343, HARP's observation command line arguments were set to --HARP_ObsPOCs=3 --HARP_ObsCTUs=343.
Note that no Python code is involved here, all images were created from inside the HM code, in C++ language only. All images below can be reproduced by the sources in the current download version of HARP. If you are interested in HARP+Python, see one of our upcoming tutorials of how to use Python for easy data export from the HM, subsequent postprocessing and the creation of publication-ready figures.
Visualization of HEVC Mode Decisions, Reference Indices and Transform Units
For better view, click the images to enlarge.
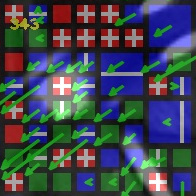
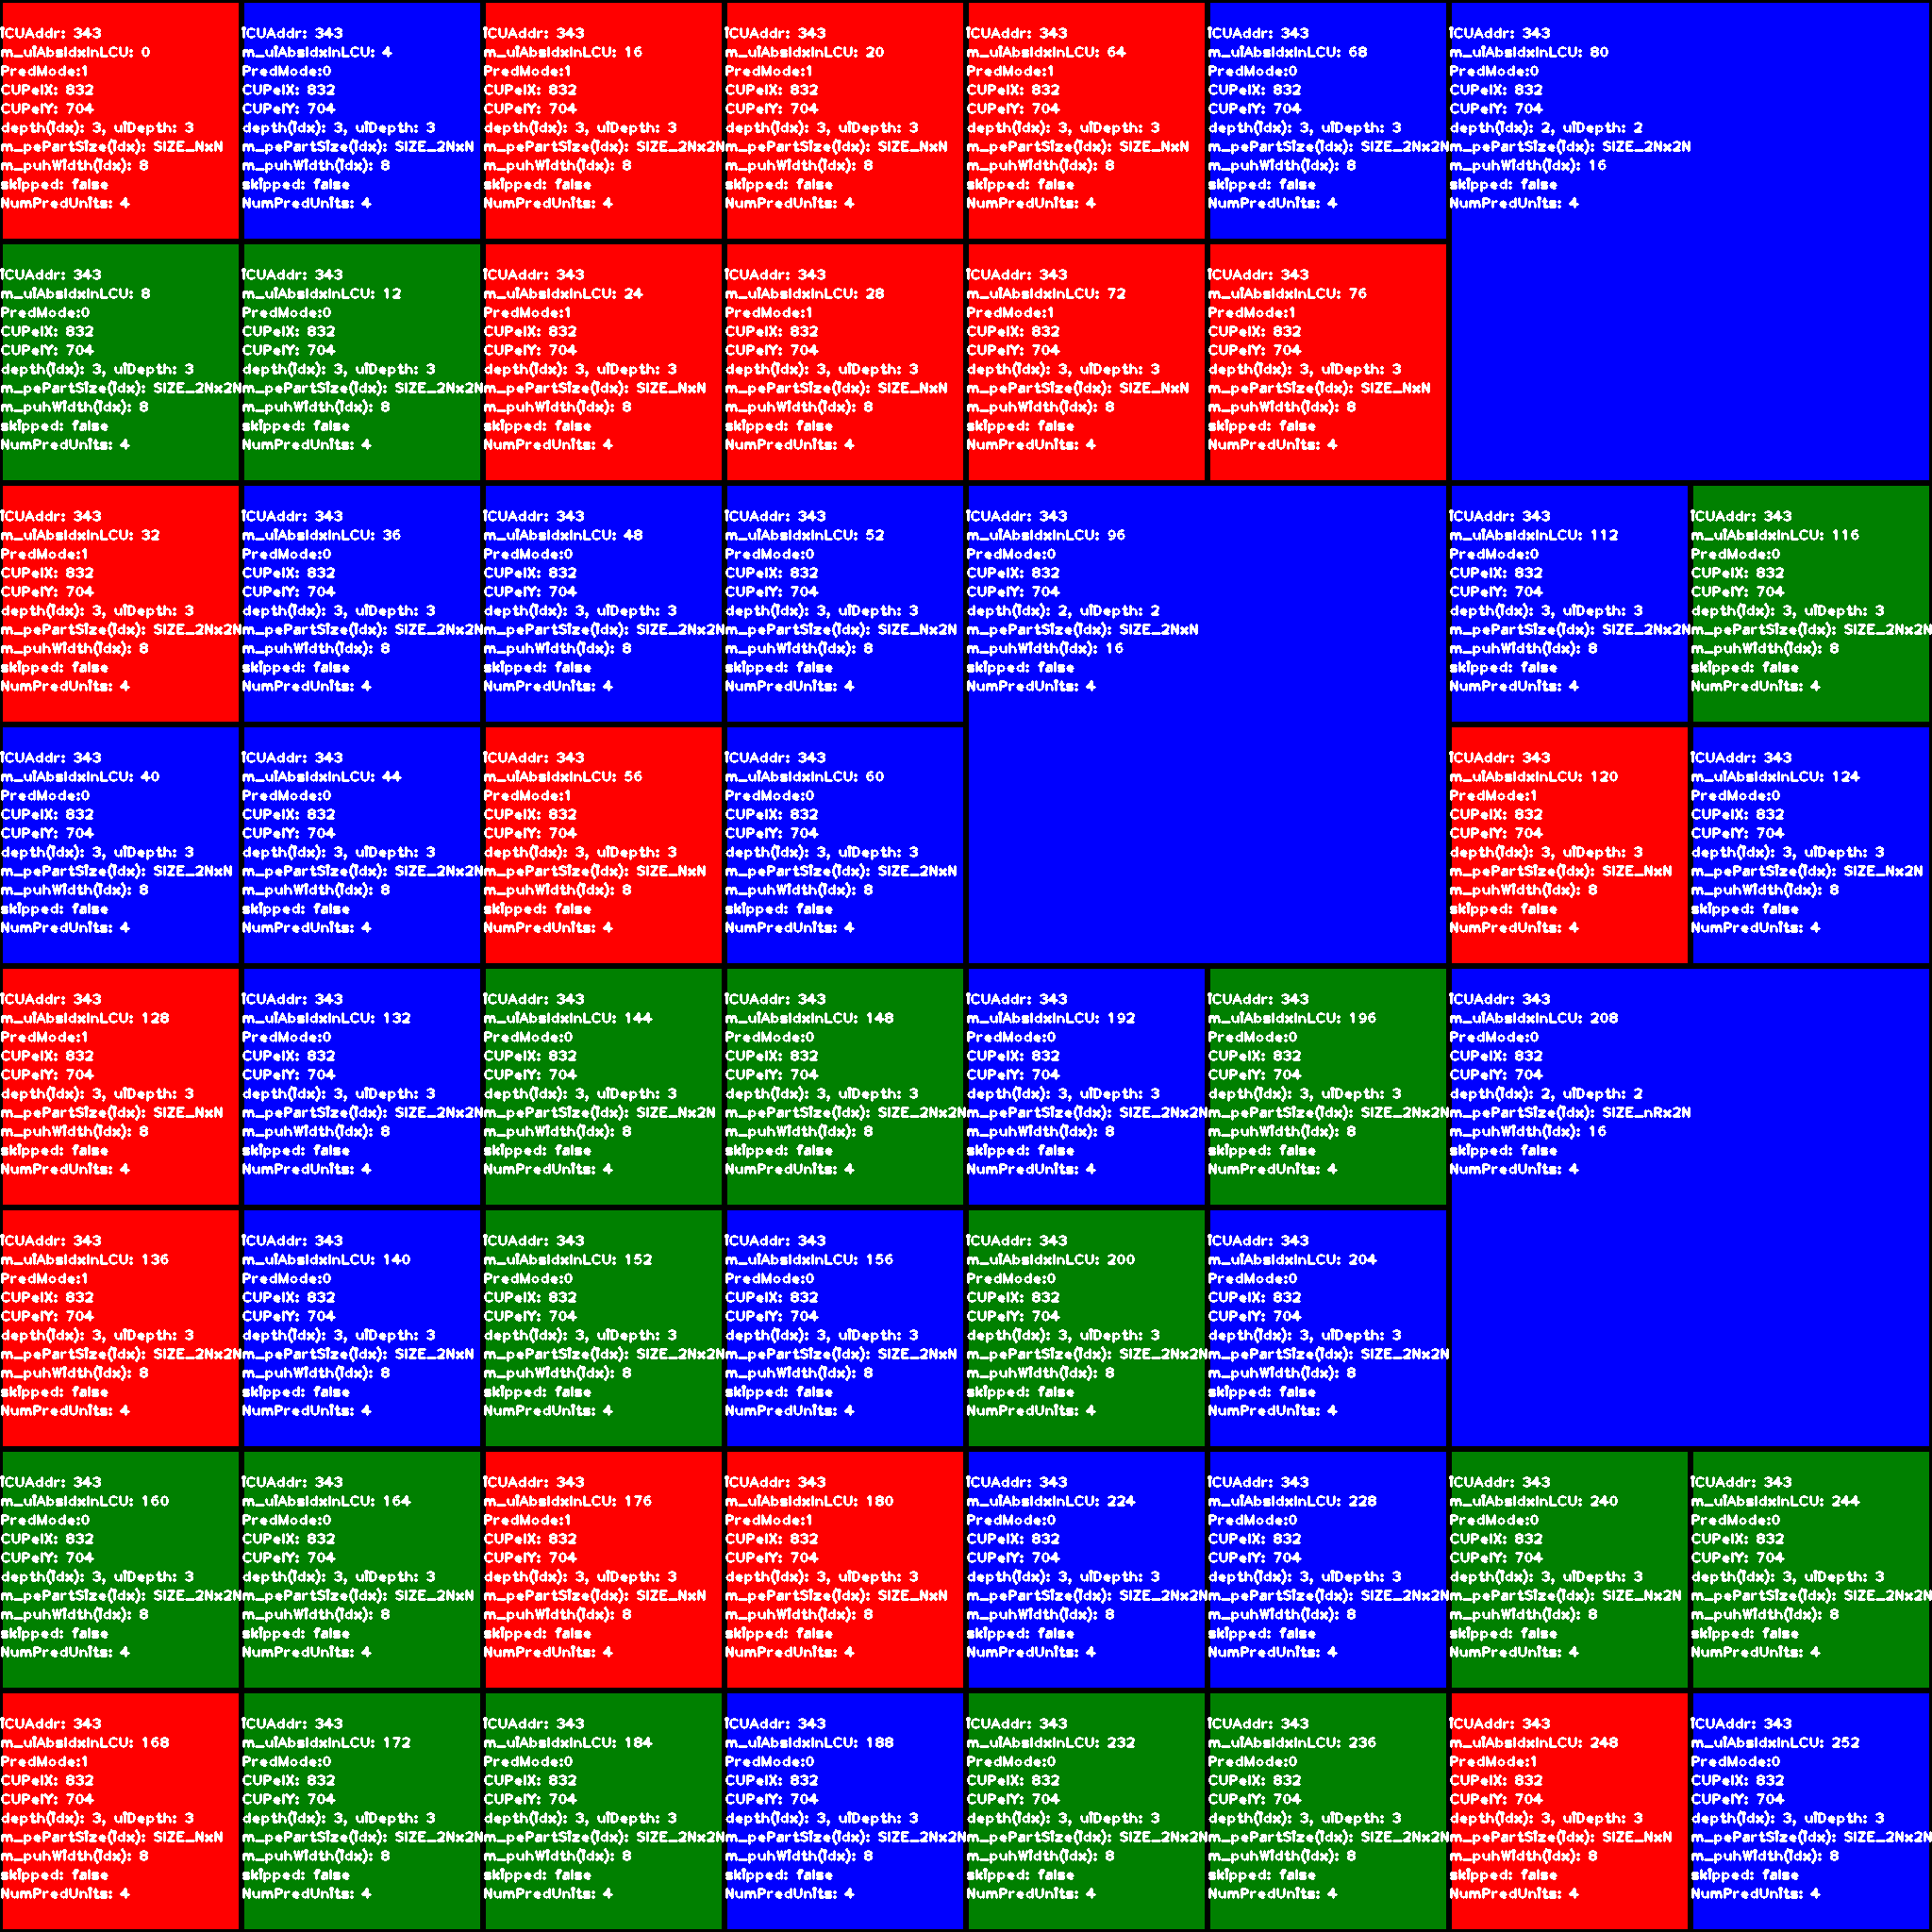
From left to right, top to bottom: original POC, prediction units, reference indices and transform units.
Prediction/transform units: red color indicates Intra, blue color Inter and green color Merge/Skip.
Reference indices: blue/orange/purple color indicates the first/second/third reference frame
 |
 |
 |
Visualization of HEVC RDO Evaluations of a Specific CTU
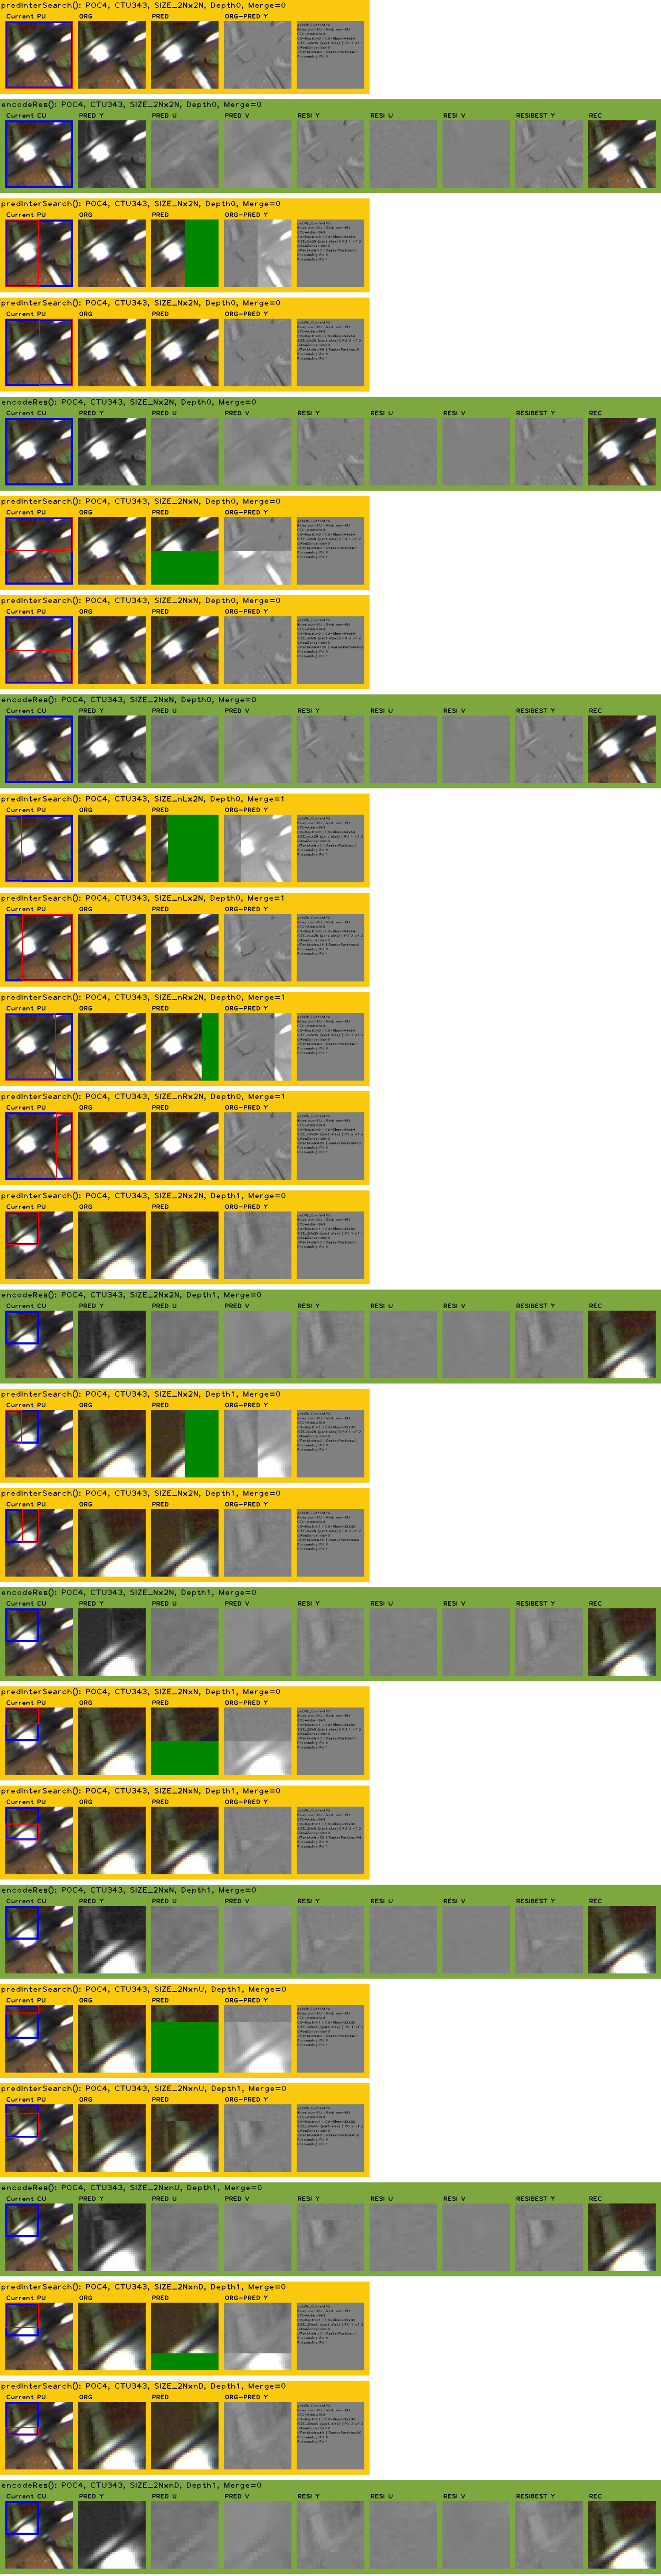
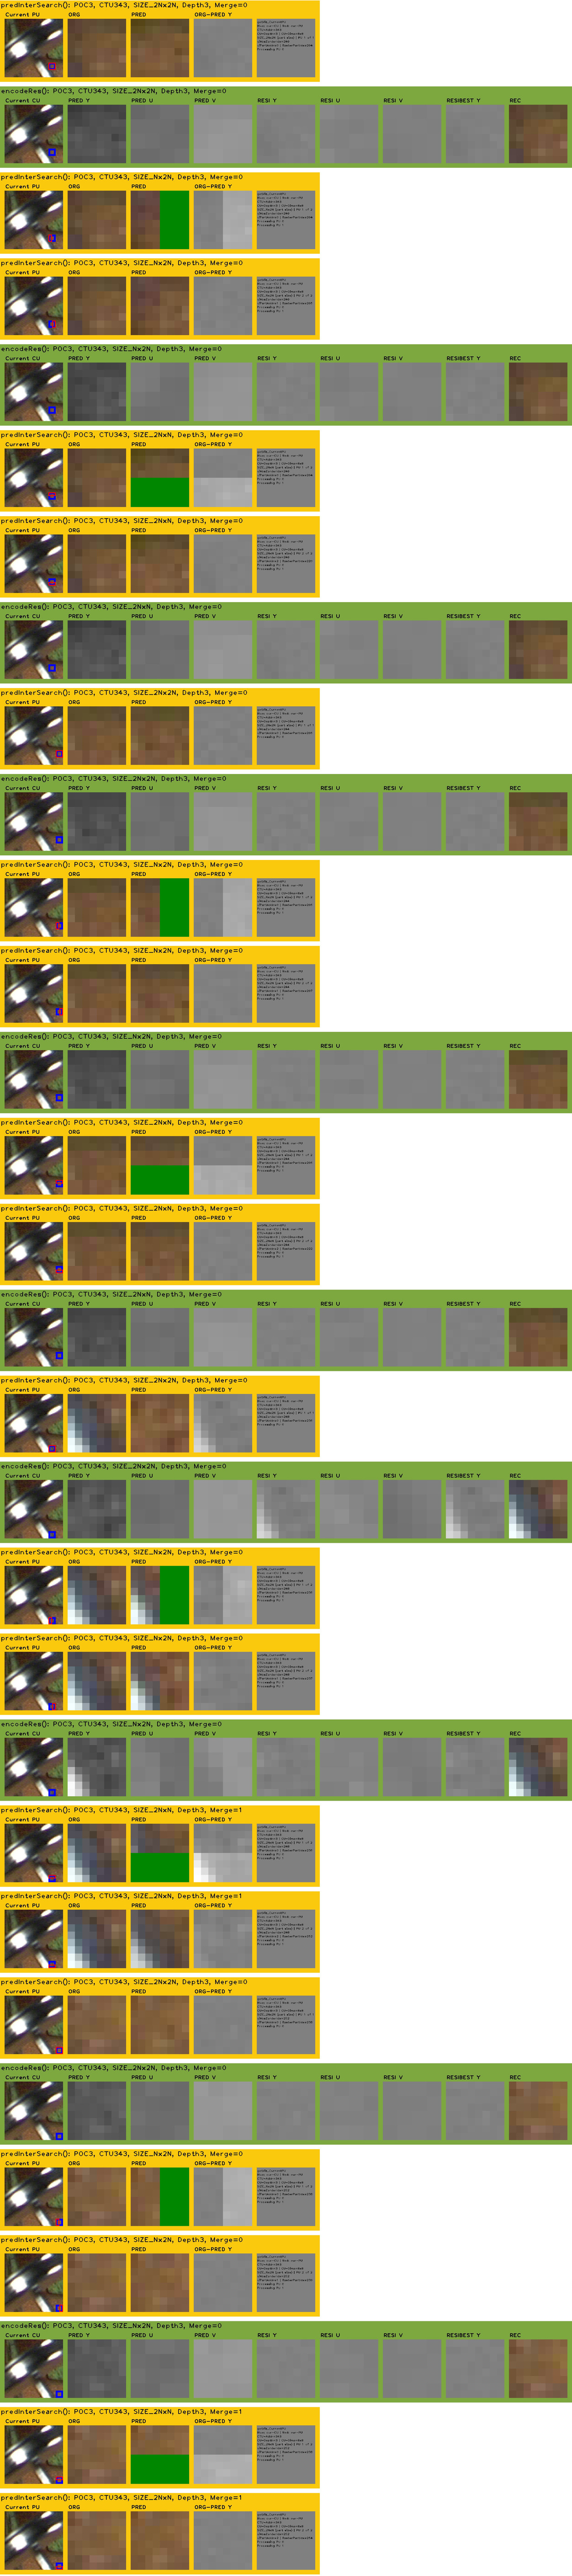
Depicted below is a HARP visualization of all predInterSearch() tests performed on the first two CU sizes in POC 4 (64x64 and 32x32, upper left corner). Observed CTU is CTU 343, which holds most parts of the rotating pendulum in POC 4 of sequence Cactus_1920x1080_50.yuv. After HM’s predInterSearch() found the best motion vector for the current PU (yellow rows), encodeResAndCalcRdInterCU() calculates the corresponding residual (green rows). Current PUs are depicted in red color.
A Closer Look: Configuring HARP for Full RDO Inspection
As can been seen above, the second and third Nx2N predInterSearch() tests are able to approximate the rotational motion of the swinging pendulum better than the first 2Nx2N test, but still suffer from strong prediction error and residual energy. A closer look at the Prediction Unit visualization above unveils that the best modes found after rate-distortion optimization (RDO) of CTU 343 are resorting to high depths (i.e. small CUs) and many individual motion vectors to replicate the rotational motion:
 |
 |
Sometimes, you may want to know specific information only from specific code parts of HM. For example, it would be interesting to see how these small CUs perform during RDO, since they actually get picked by RDO as best partitioning. While HARP provides commonly used functionality via command line, it can be adapted to specific needs by switches inside the HARP C++ code. To find out how the last four CUs in the bottom right corner of CTU 343 perform, change MaxRows to 1000 in CHelper.h and recompile HARP. You will then receive a visualization of all RDO inter tests, split up to 14 image files with 50 rows each (8GB RAM recommended). The following image is part of the last file created, depicting RDO tests of these last four CUs of size 8x8 (compare to the PU and Closeup visualization above).
Using HARP+Valgrind for profiling and creating HM call graphs from running code
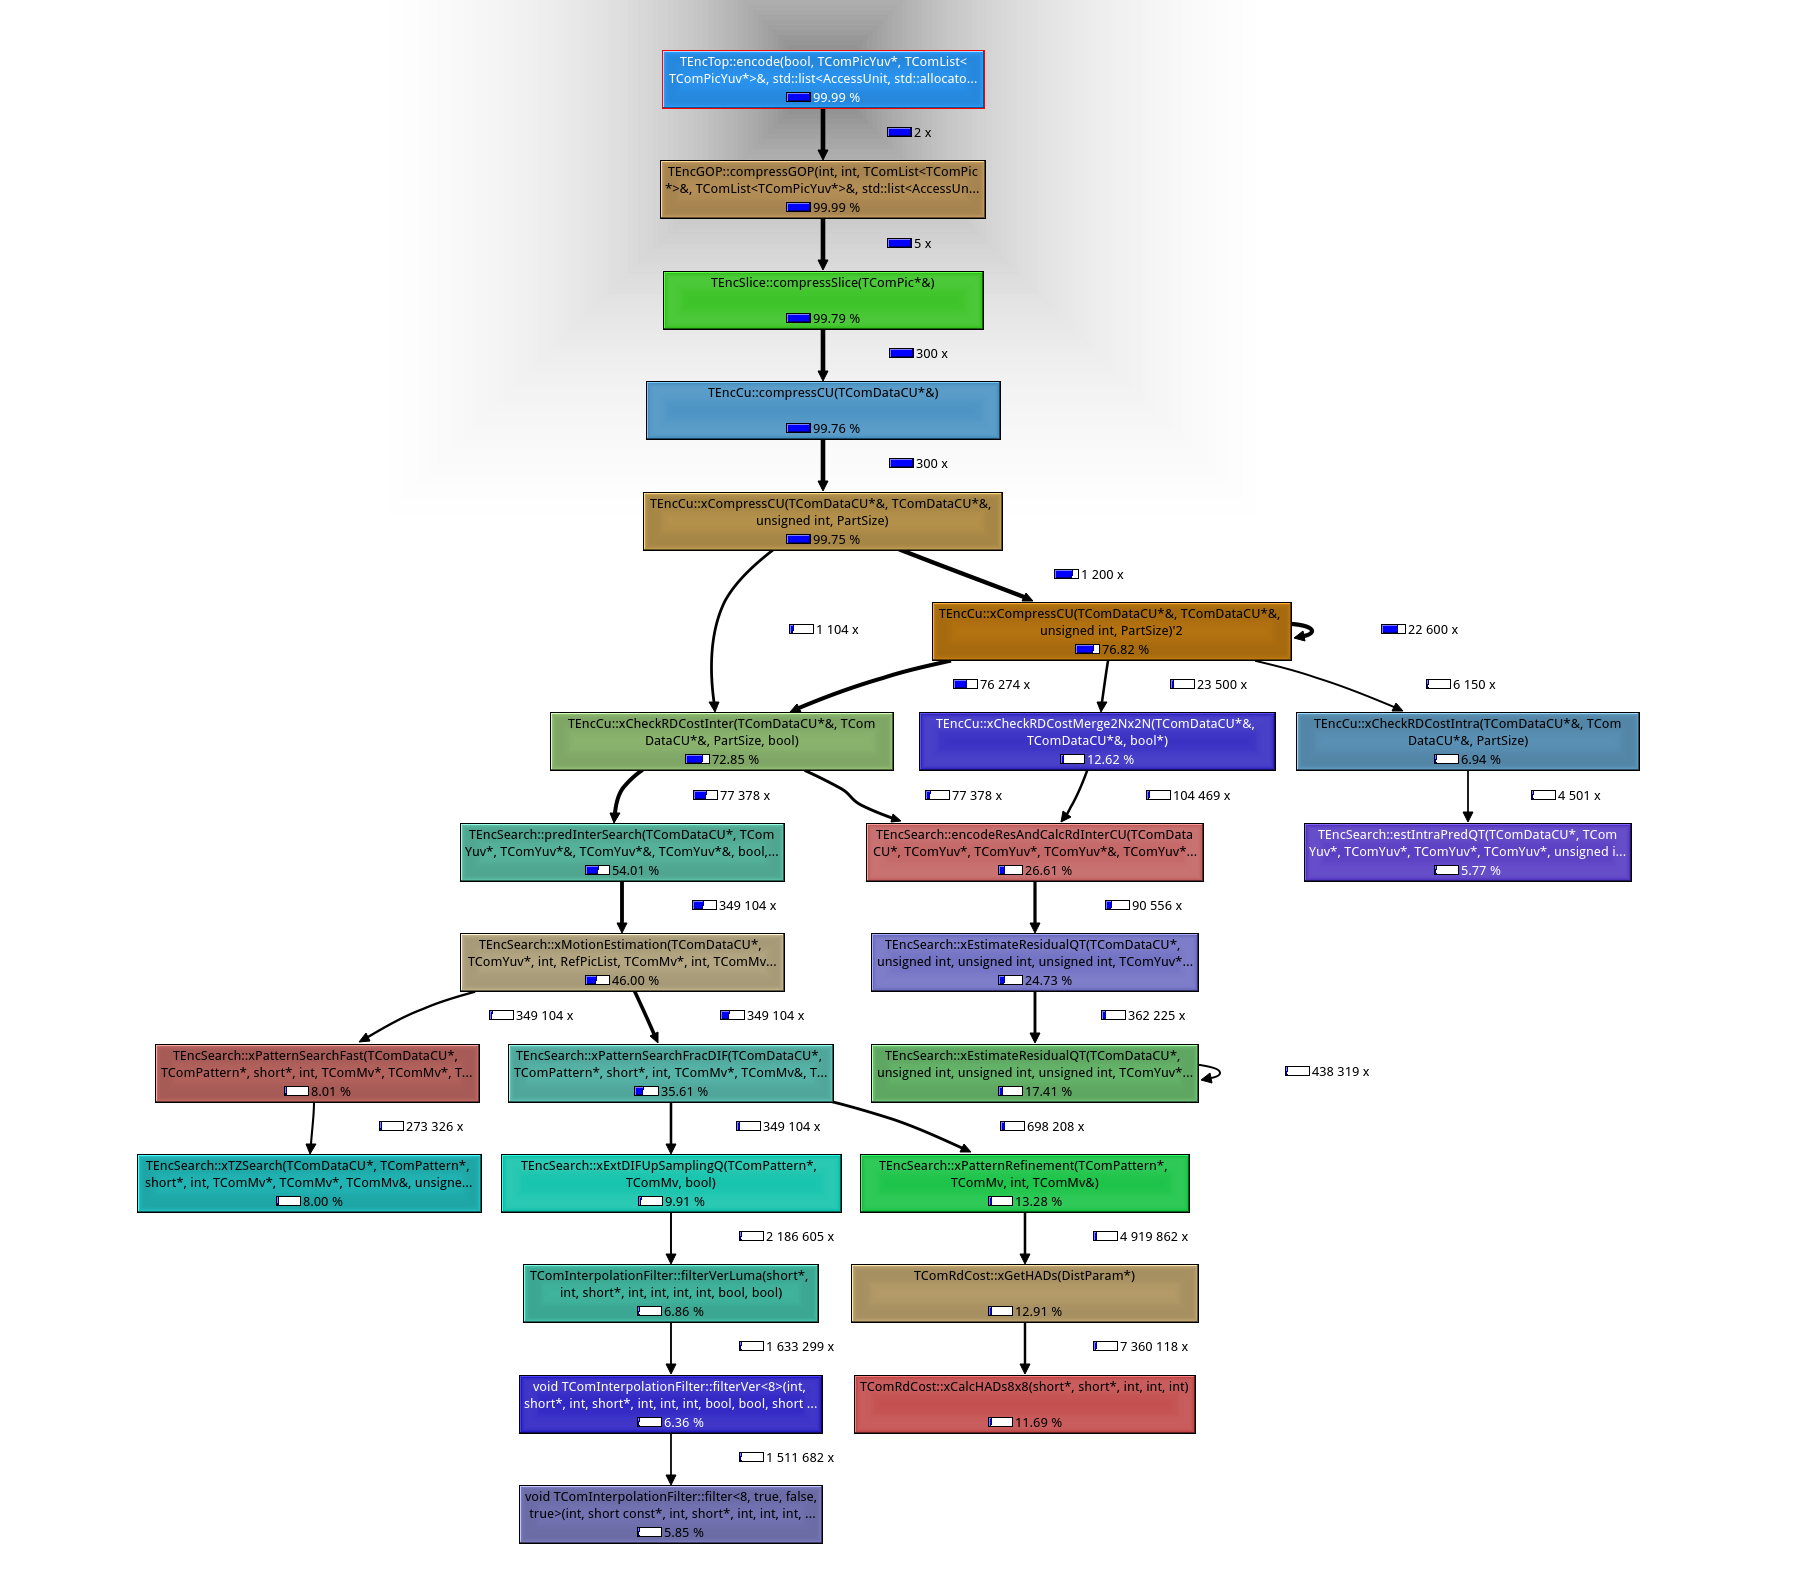
HARP provides the switch ACTIVATE_CALLGRIND, located in the source file Defines.h. Callgrind is a profiling and call graph generation tool provided by the excellent, open source Valgrind software (Linux only). The switch activates Callgrind profiling instructions inside the HM code. Using this switch, call graphs like the following can be easily created. This following graph depicts the relative CPU utilization in each function inside the HM, for the first POC (i.e. Intra ONLY), encoding the test sequence LMS_640x360.yuv:
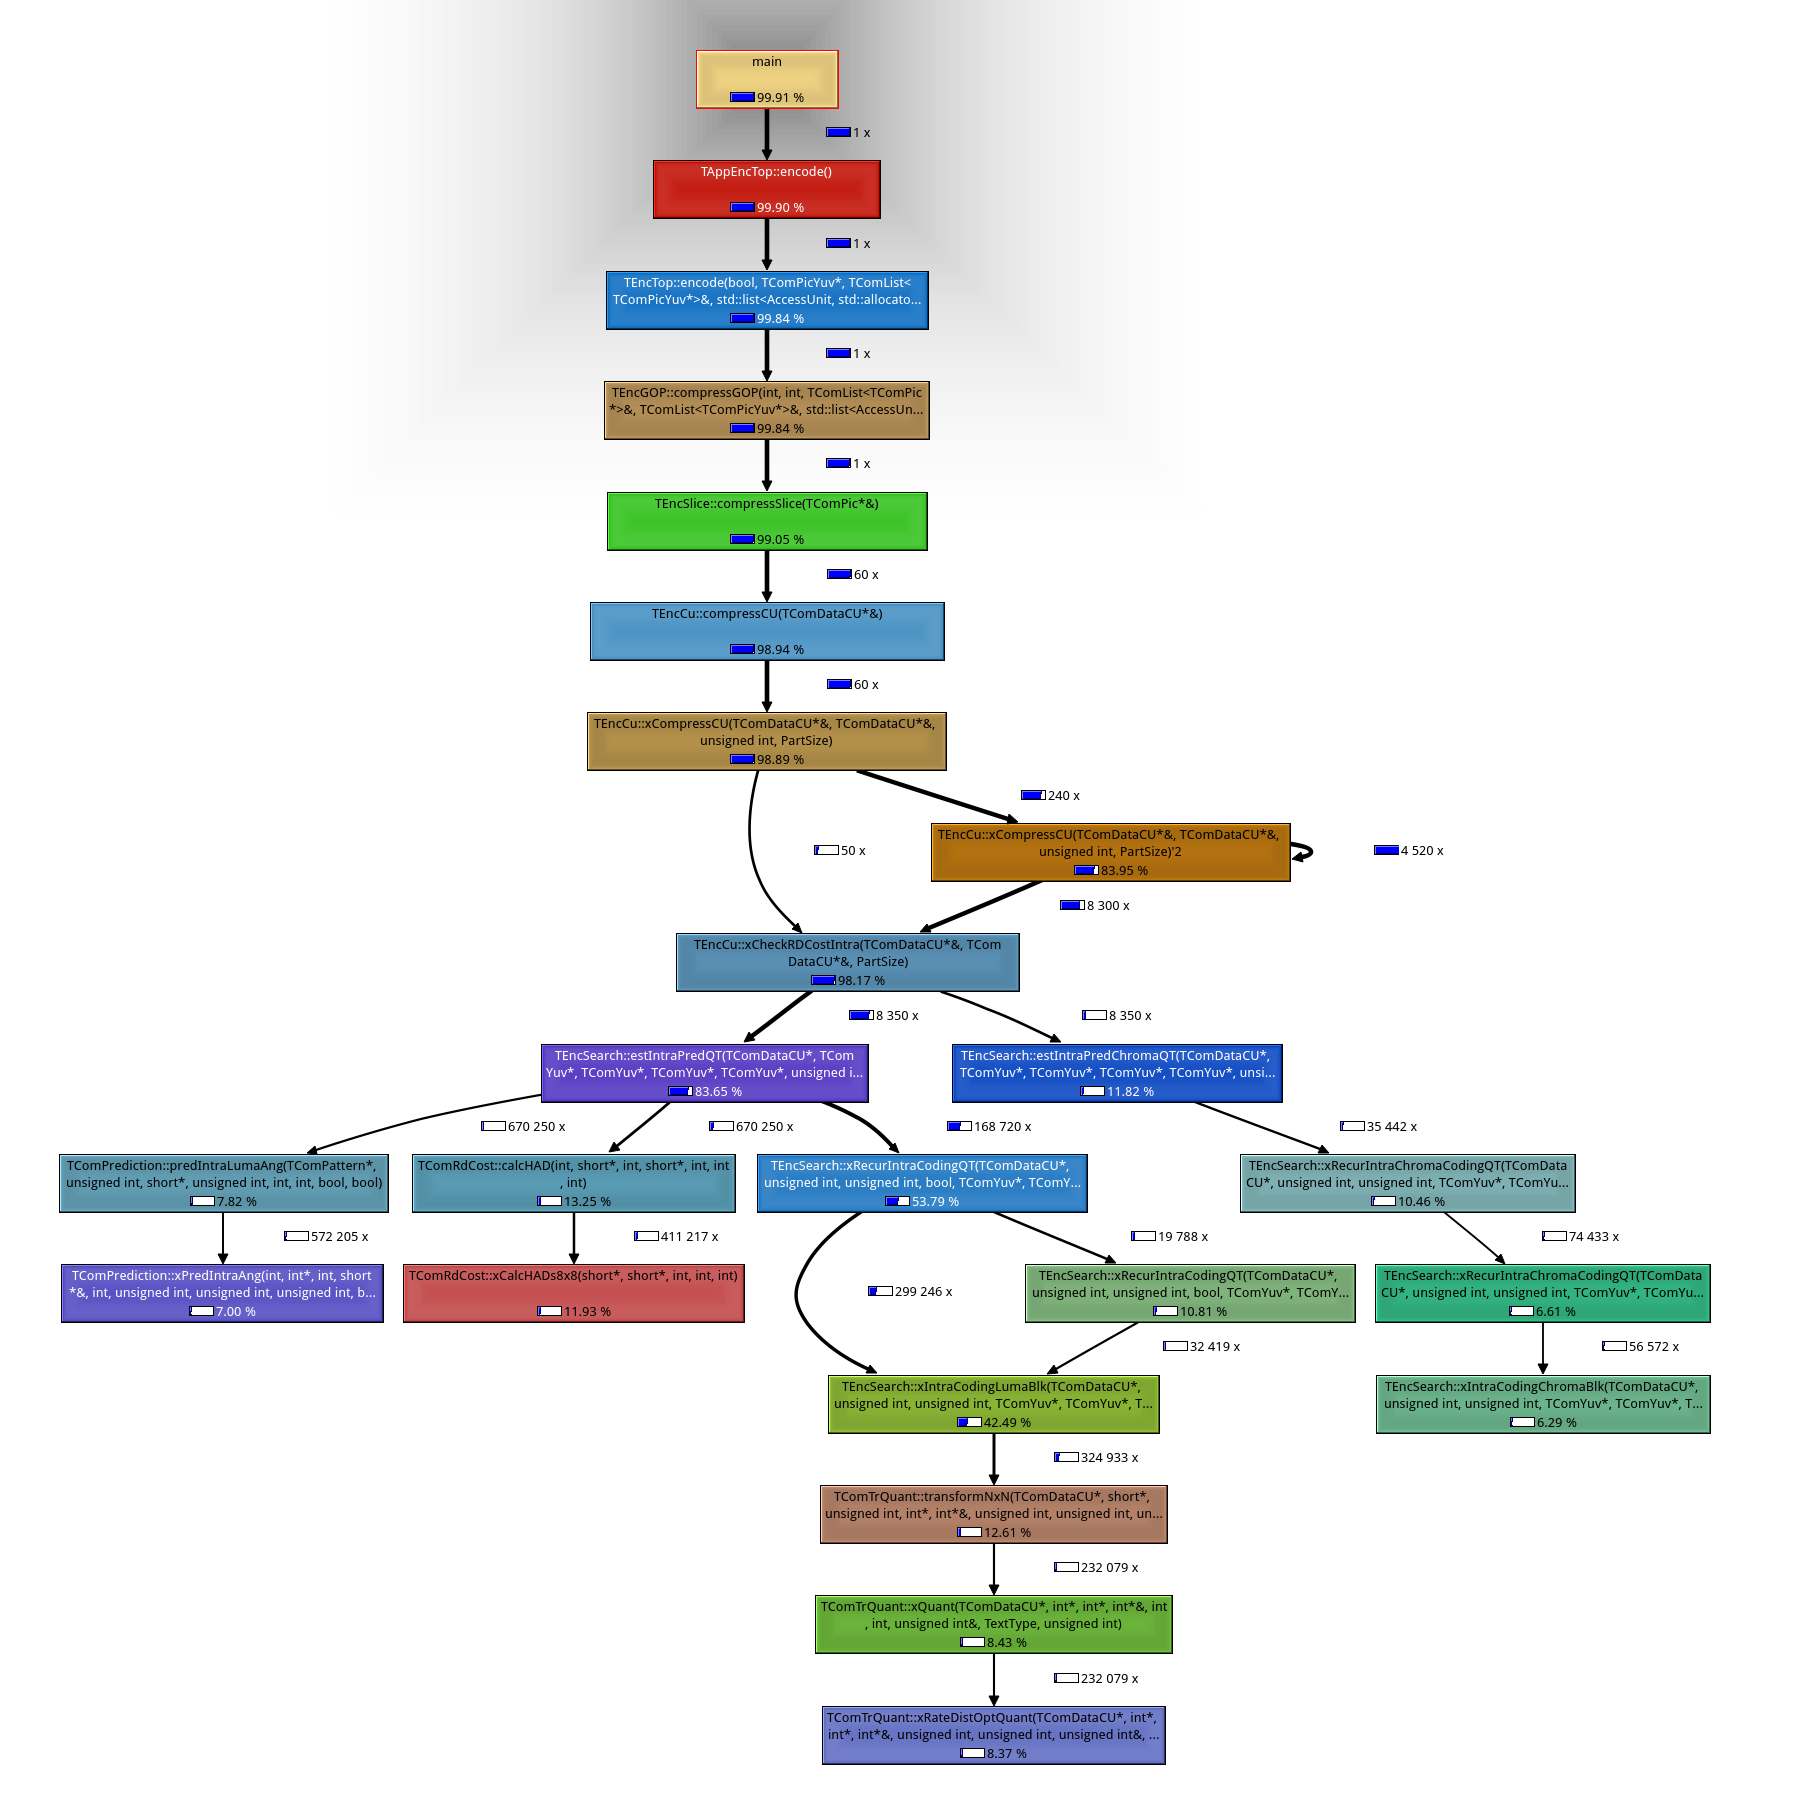
You can also exclusively restrict the profiling to Inter frames by placing simple counters in HARPs START_CALLGRIND and STOP_CALLGRIND macros, effectively switching profiling on only after all Intra processing in POC 0 has been finished. The following graph depicts such a profiling run (note that Intra RDO tests still account for around 7% processing time, since Intra CUs are tested for Inter POCs as well):